join the newsletter to Turn your paycheck into passive income
Stocks Portfolio Builder
Build your dividend and stock portfolio with the best services and platforms we recommend.
Building a Stock Equity Portfolio
Building a high-performing portfolio isn’t about chasing trends; it’s about implementing a repeatable system. To generate consistent passive income, you need a streamlined process and reliable tools that allow you to stay consistent without spending hours at a desk.
On this page, I’ve curated the exact resources I use (or would recommend to a close friend) to build a Stock Equity portfolio from the ground up. Every service listed here has been vetted for two things: high quality and a low learning curve. I have personally tested and designed this builder through countless hours of trial and learning.
My goal is to help you build a self-managed income stream as frictionless as possible. Time spent building any portfolio is also a cost, and it can quickly reduce your effective returns, eventually turning something passive into something that isn't. To get started, follow the three steps below:
Note: Some links on this page are affiliate links. I only recommend tools I personally trust to help you build long-term wealth. You can view our full terms and conditions.
Identify high-potential opportunities and validate your strategy.
Secure your assets or build them from scratch using the best-in-class platforms.
Oversee your progress and automate your passive income flow.
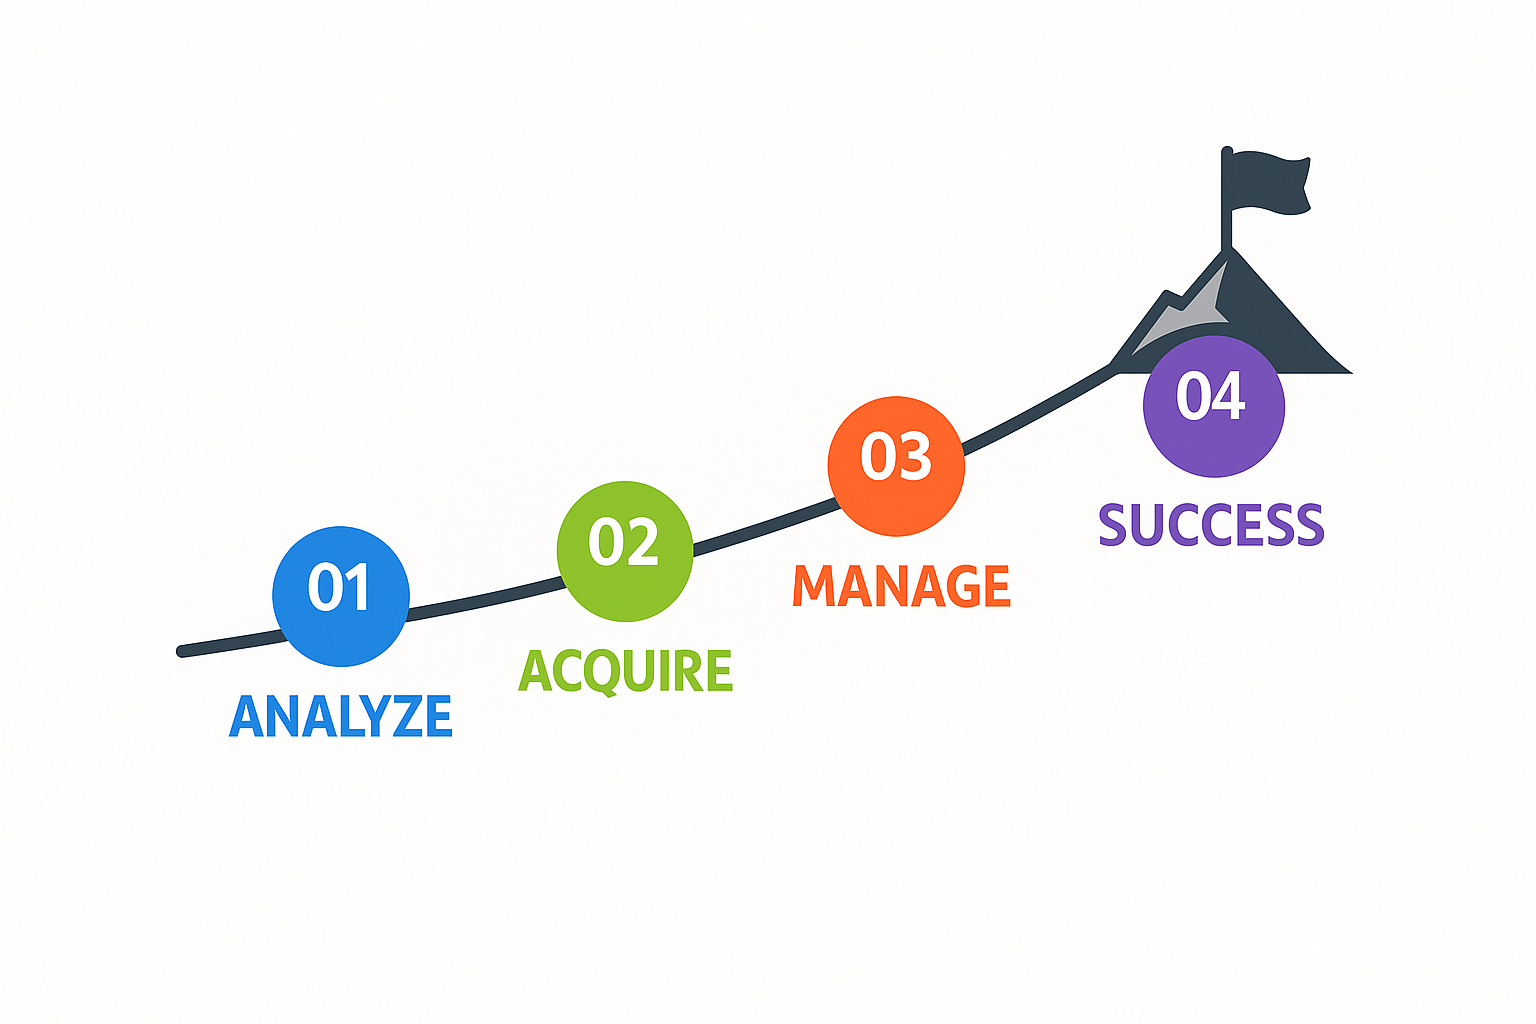
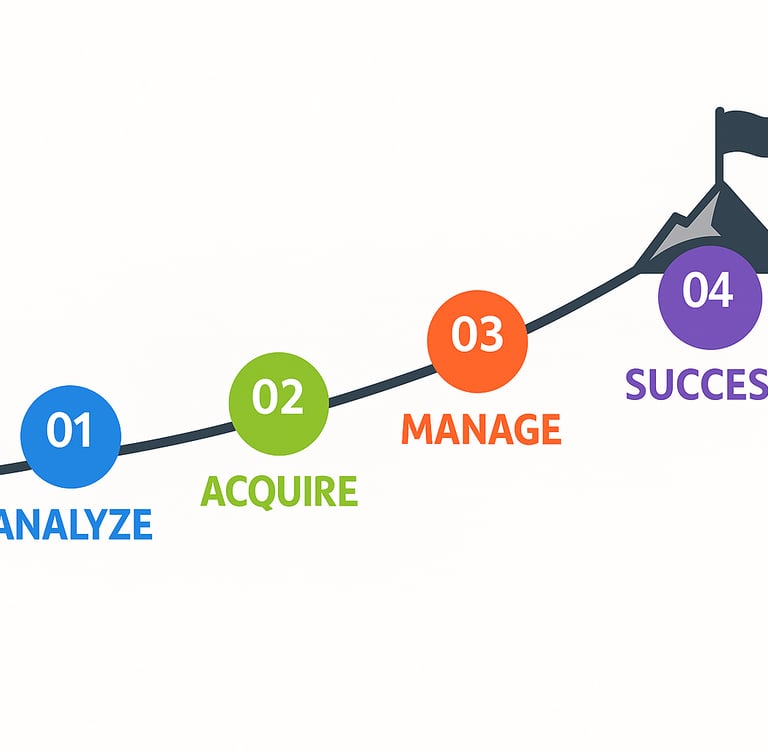
Step 1. Analysis & Evaluation
The Goal: To filter out assets that do not meet your objectives and identify assets with potential for long-term passive income.
Most investors fail because they guess. In the stock market, "guessing" is the fastest way to lose your principal. This step is about using professional-grade data to find the "unfair advantage" before you put a single dollar at risk. A successful evaluation means you are buying an asset with a mathematical probability of success; skipping it means you’re just gambling. To get started, you don't need a finance degree—you just need the right information. The tools below are the exact sources I use to strip away the noise and find the opportunities that others miss.
Our top pick for fast, fundamentals‑first stock research
FAST Graphs

Watch the tutorial:
This is an affiliate link, which helps support our site at no extra cost to you.
Best for
Long‑term investors and dividend investors who want to quickly see if a stock’s earnings, valuation, and dividends actually justify the current price, without digging through endless filings.
Why I use it & recommend it
FAST Graphs is the very first place I go anytime I’m researching a new stock or checking in on my existing positions. It’s a fundamentals‑first tool that shows you, in seconds, how a company’s earnings, valuation, and dividends have behaved over time—so you’re not just staring at a price chart and guessing.
Instead of bouncing between financial statements, random blogs, and broker screens, I can pull up one FAST Graphs chart and see:
Is this business actually growing?
Has the stock usually traded at a premium or discount to its earnings?
What does the dividend history look like—steady, growing, or shaky?
The team behind FAST Graphs built it to be, well, fast. It’s designed so you can visually compare price vs. earnings, revenue, dividends, and valuation ratios in one place, and quickly judge whether a stock looks overvalued, fairly valued, or undervalued based on its fundamentals.
I’ve used FAST Graphs for over five years, and I don’t see myself ever cancelling. It’s become part of my monthly maintenance rhythm: I run through my positions at least once a month, check valuations, and review dividend income and forecasts. It helps me avoid overpaying for hype. It keeps my focus on businesses with real earnings power and reliable dividend histories, exactly what you want when you’re building a long‑term, income‑producing portfolio.
If you’re serious about dividends and portfolio investing, this is the tool that helps you think like a fundamentals‑driven analyst without having to spend analyst‑level time. Out of all my subscriptions that I pay for, this is the one that like best.
Pros
Fundamentals at a glance: Quickly see earnings, valuation, and dividend history on one clean chart.
Great for dividend investors: Easy to visualize dividend payout ratios, yields, and growth trends over time.
Built‑in forecasting tools: Let's you estimate potential future returns based on historical growth and analyst estimates.
Huge coverage universe: Tens of thousands of U.S., Canadian, and international companies, depending on your plan.
Massive time saver: Replaces a lot of manual spreadsheet work and clicking around between data sources.
Cons
Not free long‑term: There’s a subscription cost after the trial; it's worth it if you actually use it, but it's not a casual toy.
Learning curve: The charts are powerful, but you’ll need a bit of time to get comfortable reading them.
Not a trading platform: You still place trades through your broker—FAST Graphs is for research, not execution.
Best for fundamentals people: If you only care about short‑term trading or pure technicals, this is overkill and not the right fit.
Steps to get started:
Sign Up: Use the link and discount below and select a subscription plan (the "Basic" tier is usually sufficient for beginners).
Search a Ticker: Use the search bar at the top to enter a stock symbol (e.g., AAPL or MSFT).
Review the Orange Line: Look at the "Earnings Line" (Orange) vs. the "Price Line" (Black) to see if the stock is currently overvalued or undervalued relative to its historical earnings.
Check the Dividend: Review the light blue shaded area to verify the company’s dividend growth history and payout consistency.
Run a Projection: Use the "Forecasting" tab to estimate your potential total return over the next 3–5 years based on analyst estimates.
Our top pick for intangible analysis and moat strength
Morningstar Investor

Watch the tutorial:
This is an affiliate link, which helps support our site at no extra cost to you.
Best for: Individual investors who want to seriously analyze stocks, ETFs, and funds using fundamentals and lean on professional research while still staying in control of their own portfolio.
Investors who know the basics of company performance (earnings, cash flow, ROIC, etc.) and want a deeper, moat‑focused view.
9–5 employees who are past the “just buying random tips” stage and now want structured research to build a long‑term stock or dividend portfolio.
Value‑ and income‑oriented investors who care about paying a fair price, not just chasing what’s going up today.
DIY investors who want to supplement broker tools with institutional‑grade analysis, ratings, and screening.
Why I use it & recommend it
Morningstar Investor is one of the few tools I’ve stuck with for more than five years. For me, it’s the research backbone that sits between raw financial data and actual decisions, especially when I’m weighing long‑term, dividend‑friendly businesses.
I lean hard on their moat analysis. Morningstar’s “economic moat” work is genuinely hard to replicate on your own. They dig into competitive advantages, brand strength, switching costs, cost advantages, network effects, and more, and boil it all down to a moat rating. Because I’m willing to pay a higher valuation for stronger, more durable moats, this saves me hours of guesswork and gives me a consistent framework for comparing companies.
Their fair value/valuation estimates and star ratings are next on my list. I don’t consider their fair value infallible; Morningstar can be inaccurate, and I’ve seen enough to stay cautious, but it remains a helpful anchor. Combined with the 1–5 star rating system on stocks, ETFs, and funds, I can very quickly see: “Is this considered undervalued, fairly valued, or expensive relative to Morningstar’s model?” It helps narrow the universe, so I spend my deep‑dive time on the most promising ideas.
Where Morningstar really earns its subscription fee for me is the analyst commentary. This is the nuance you don’t get from financial statements or earnings call transcripts. Their analysts follow sectors for years, and you see that in how they talk about industry shifts, competitive threats, and management decisions. When I’m on the fence about a stock, I’ll often go straight to Morningstar to read their take before I move forward.
Is it perfect? No. I wish the valuation models were more consistently reliable and that some of their rating methodologies were more transparent. But for an individual investor who wants professional‑grade fundamental research without working on Wall Street, it’s one of the most complete, practical tools I’ve found. If you’re building a long‑term stock and dividend portfolio and want to avoid overpaying or buying weak businesses, Morningstar can be a very strong research partner.
Pros
Best‑in‑class moat analysis: Morningstar’s economic moat ratings and commentary give you a structured way to judge business quality, which is critical if you’re paying up for durable dividend payers and long‑term compounders.
Professional analyst insight in plain English: In‑depth reports and notes from experienced analysts help you understand what actually matters for a business—industry dynamics, competitive threats, management quality—without you having to be an expert in every sector.
Helpful valuation and star ratings as a starting point: Fair value estimates and 1–5 star ratings on stocks, ETFs, and funds make it easy to screen for potentially undervalued ideas and quickly filter out obvious “too expensive” names.
Huge coverage universe: Research and data on hundreds of thousands of stocks, mutual funds, and ETFs means you can analyze almost any mainstream investment you’re interested in, not just a small list of picks.
Fast, efficient for repeat use: Once you’re familiar with it, it’s quick and easy to use—you can pull up a ticker, check moat, valuation, and key commentary in a couple of minutes, which is invaluable if you research regularly around a 9–5 job.
Cons
Valuation estimates are not always reliable: Morningstar’s fair value can be very useful, but it’s far from perfect—you still need your own judgment and should never buy purely because a stock shows as “undervalued.”
Some ratings feel like a black box: Not all rating systems are fully transparent, which can be frustrating if you like to understand exactly how a score is calculated before relying on it.
Can be overwhelming for total beginners: While you find it easy and quick to use now, brand‑new investors might feel intimidated by the volume of data and reports until they learn the basics of financial statements and valuation.
Steps to get started:
Create an Account: Use the link below and start a free trial or subscription.
Access the "Analysis" Tab: Search for a stock and click on the "Analysis" tab to read the full analyst report.
Check the Economic Moat: Look for a "Wide" or "Narrow" Moat rating; this tells you if the company has a sustainable competitive advantage.
Review Fair Value: Compare the current market price to Morningstar’s "Fair Value Estimate" to see if the stock is trading at a discount.
Evaluate Capital Allocation: Read the "Stewardship" or "Capital Allocation" section to see how well the management team handles shareholder money.
Step 2. Acquisition & Development
The Goal: To move from theory to ownership by securing or building your assets using the most efficient methods.
This is where your strategy becomes a reality, but it’s also where most people get stuck in "analysis paralysis" or end up losing money to hidden fees. Your goal here is to secure your stock portfolio using the path of least resistance. The difference between a pro and an amateur is the platform they use; a pro uses tools that offer low friction, high security, and maximum control. To move forward, you need a reliable gateway that handles the heavy lifting of the transaction or the build. I’ve narrowed down the field to the only platforms that are actually worth your time and capital.
Our top pick for a simple, low‑fee brokerage with strong bonuses
Robinhood

Watch the tutorial:
This is an affiliate link, which helps support our site at no extra cost to you.
Best for: New and intermediate investors who want a clean, easy‑to‑use brokerage app with low fees and attractive transfer/deposit bonuses, especially if you value simplicity over complex features.
Why I use it & recommend it
Robinhood is one of the two brokerages I use to place trades and hold positions. It’s not perfect (I’ll be honest about that), but it does a few important things really well.
First, fees and rewards. Robinhood is known for low trading costs, and what really stands out to me is the matching on deposits and transfers. I’ve transferred accounts specifically to capture some of the larger rewards, which can be a meaningful boost as you steadily build a portfolio from a 9–5 paycheck.
I’m also a Robinhood Gold member, and one standout benefit I’ve taken advantage of is their mortgage program, which helped me secure a great mortgage rate through their ecosystem. That’s not something every brokerage offers, and it ties directly into real-life goals, like lowering one of your biggest monthly expenses.
The app itself is simple and easy to use, with clear trade tickets and helpful contextual information about the companies you’re looking at. It lowers the friction of actually getting started: opening an account, making your first deposit, and buying your first stock or ETF are all straightforward on Robinhood.
That said, I don’t pretend it’s perfect. The app is simple and does not provide quick access to detailed information about your portfolio. The positions and holdings views don’t show as much detail as I’d like, especially compared to more advanced brokerages or research tools. That’s one of the reasons I use multiple brokerages. That said, they do include the Robinhood Legend platform for its accounts, which adds access to significant data but comes with a learning curve.
If you want a beginner‑friendly brokerage that still has enough features for serious investing, and you want to take advantage of deposit/transfer bonuses, Robinhood is an excellent option to consider.
Pros
Low fees: Commission‑free trades on many stocks and ETFs, which matters when you’re investing smaller amounts.
Attractive bonuses: Matching on qualifying deposits and transfers can add up if you’re strategic.
Mortgage and Gold benefits: As a Gold member, I was able to secure a strong mortgage through their program, which is a real‑world win beyond just trading.
Beginner‑friendly app: Clean interface and simple trade flow make it less intimidating for new investors.
Helpful trade information: Decent in‑app information about companies and trades for getting oriented quickly.
Cons
Portfolio views are limited: The positions screens don’t show as much detail or customization as I’d like for serious portfolio tracking.
Not a full research platform: You’ll still want external tools (like FAST Graphs and TradingView) for deep analysis.
Mobile‑first design: Great on a phone, but if you prefer a “pro‑style” desktop experience, it may feel a bit light.
Steps to get started:
Download & Register: Use the link below and complete the identity verification process (KYC).
Link Your Bank: Connect your bank account via Plaid for instant transfers so you can start trading immediately.
Search & Select: Enter the ticker symbol you identified in Step 1 and click "Trade."
Choose Order Type: For beginners, use a "Limit Order" to set a specific maximum price you are willing to pay.
Enable Recurring Investments: (Optional) Set up a daily, weekly, or monthly recurring buy to automate your portfolio growth and practice dollar-cost averaging.
Step 3. Manage & Monitor
The Goal: To protect your gains and automate the "passive" nature of your income.
If you have to work 40 hours a week to manage your "passive" income, it isn't passive—it’s a second job. This step is what separates a hobbyist from a wealth builder. Successful management means automating your tracking so you can spend your time building your next portfolio, not staring at spreadsheets. Without these tools, your portfolio will eventually become a chaotic mess that demands your attention. Use the management resources below to put your stock portfolio on autopilot and ensure your income is actually working for you.
Our top pick for charts, technicals, and watchlists
TradingView

Watch the tutorial:
This is an affiliate link, which helps support our site at no extra cost to you.
Best for: Anyone who wants professional‑grade charts in a browser or app—whether you’re just watching your dividend holdings or actively timing entries and exits with technical analysis.
Why I use it & recommend it
Where FAST Graphs is my fundamentals workhorse, TradingView is my daily price‑action dashboard.
I’ve used TradingView for over 10 years, and it’s where I do all of my technical analysis. It’s the platform I have open multiple times a day during the week to:
See how my positions are trading intraday
Monitor my watchlists
Map out support, resistance, and trendlines
Publish and review trading ideas
TradingView gives you clean, highly customizable charts with just about every technical indicator you could want. It’s cloud‑based, so my watchlists, layouts, and ideas stay synced across devices, and I can flip between names in seconds instead of wrestling with clunky broker charts. Their mobile app is very UX friendly, I don't miss a beat doing research on my phone.
For a Paycheck‑to‑Portfolio™ approach, TradingView is especially useful for:
Planning better entry points for long‑term holdings
Avoiding impulsive buys in the middle of obvious downtrends
Keeping an eye on overall market health while you focus on your 9–5
I also publish some of my ideas on TradingView, so it doubles as a way to document and stress‑test my thinking over time.
Pros
Excellent charts: Clean, fast, and highly customizable charting that beats most broker platforms.
All‑in‑one technical toolkit: Dozens of built‑in indicators, drawing tools, and multiple timeframes from intraday to monthly.
Cloud‑synced watchlists: Track all your stocks and dividend names in one place, across devices.
Community ideas: You can see and share trading ideas, which can be useful for learning and perspective (with a healthy dose of skepticism).
Great for daily check‑ins: Quick way to see how your positions are moving without logging into multiple brokerages.
Cons
Can be overwhelming at first: So many features that beginners might feel lost; you don’t need all of them to benefit.
Subscription for advanced features: The free tier is solid, but more alerts, more indicators per chart, and some data require a paid plan.
Can encourage over‑trading if you’re not disciplined: Constant price updates and ideas feed can tempt you into short‑term trades that don’t fit your long‑term plan.
Steps to get started:
Join for Free: Use the link below to open a free account. You can upgrade later to access more features.
Create a Watchlist: Click the "Watchlist" icon on the right sidebar and add the tickers you currently own or are tracking.
Set Price Alerts: Right-click on a stock's price chart and select "Add Alert" to be notified via email or app if a stock hits your target "Buy" or "Sell" price.
Apply Basic Indicators: Use the "Indicators" button to add a "Moving Average" (e.g., 200-day) to see the long-term trend of your holdings.
Sync Across Devices: Download the mobile app and log in to ensure your watchlists and alerts are with you wherever you go.
CheatCode Wealth™
Build your wealth. Keep your life.
© 2025. All rights reserved. Cheatcode Wealth LLC. This webpage may contain paid affiliate links.